Index Trend Analysis Report
Prepared for you on Wednesday, March 25, 2026.
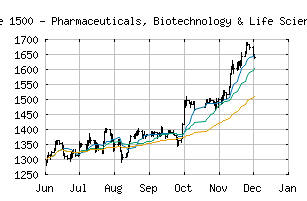
S&P Composite 1500 - Pharmaceuticals, Biotechnology & Life Sciences (Industry Group) (CME:SP1500-3520)
Countertrend Down (-85) - SP1500-3520 is showing short-term strength. However, look for the longer-term bearish trend to resume. As always, continue to monitor the trend score and set stops.
Is it time to buy, sell, or avoid SP1500-3520?
MarketClub looks at technical strength and momentum to determine if the timing is right for SP1500-3520.
Learn more about the Trade Triangles and how we make technical analysis as easy as buy and sell.
|
|||||||||||||||
|
|||||||||||||||
MarketClub’s Trade Triangles for SP1500-3520
![]() The long-term trend has been DOWN since Mar 20th, 2026 at 1585.53
The long-term trend has been DOWN since Mar 20th, 2026 at 1585.53
![]() The intermediate-term trend has been DOWN since Mar 3rd, 2026 at 1697.54
The intermediate-term trend has been DOWN since Mar 3rd, 2026 at 1697.54
![]() The short-term trend has been UP since Mar 25th, 2026 at 1614.73
The short-term trend has been UP since Mar 25th, 2026 at 1614.73
Smart Scan Analysis for SP1500-3520
Based on our trend formula, SP1500-3520 is rated as a -85 on a scale from -100 (Strong Downtrend) to +100 (Strong Uptrend).
| Open | High | Low | Price | Change |
|---|---|---|---|---|
| 1599.38 | 1628.60 | 1599.38 | 1621.63 | +22.25 |
| Prev. Close | Volume | Bid | Ask | Time |
| 1599.38 | 238552296 | 2026-03-25 16:19:30 |
| 52wk High | 1010.82 | 52wk High Date | 2018-10-03 |
| 52wk Low | 831.3 | 52wk Low Date | 2018-05-03 |