Index Trend Analysis Report
Prepared for you on Tuesday, April 14, 2026.
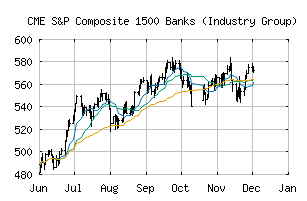
S&P Composite 1500 Banks (Industry Group) (CME:SP1500-4010)
Crossroads (+60) - SP1500-4010 is struggling to move into a solid trend. Beware of choppy markets and consider a sidelines position until a stronger trend is identified.
Is it time to buy, sell, or avoid SP1500-4010?
MarketClub looks at technical strength and momentum to determine if the timing is right for SP1500-4010.
Learn more about the Trade Triangles and how we make technical analysis as easy as buy and sell.
|
|||||||||||||||
|
|||||||||||||||
MarketClub’s Trade Triangles for SP1500-4010
![]() The long-term trend has been DOWN since Mar 2nd, 2026 at 565.75
The long-term trend has been DOWN since Mar 2nd, 2026 at 565.75
![]() The intermediate-term trend has been UP since Apr 1st, 2026 at 566.16
The intermediate-term trend has been UP since Apr 1st, 2026 at 566.16
![]() The short-term trend has been UP since Mar 31st, 2026 at 561.36
The short-term trend has been UP since Mar 31st, 2026 at 561.36
Smart Scan Analysis for SP1500-4010
Based on our trend formula, SP1500-4010 is rated as a +60 on a scale from -100 (Strong Downtrend) to +100 (Strong Uptrend).
| Open | High | Low | Price | Change |
|---|---|---|---|---|
| 605.02 | 605.02 | 595.69 | 600.26 | -4.76 |
| Prev. Close | Volume | Bid | Ask | Time |
| 605.02 | 265104015 | 2026-04-14 16:17:00 |
| 52wk High | 389.95 | 52wk High Date | 2018-01-29 |
| 52wk Low | 315.43 | 52wk Low Date | 2018-10-24 |