Index Trend Analysis Report
Prepared for you on Friday, April 3, 2026.
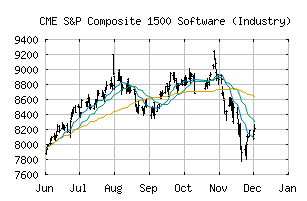
S&P Composite 1500 Software (Industry) (CME:SP1500-451030)
Bear Market Rally (-75) - SP1500-451030 is showing some rallying power, but still remains in the confines of a long-term downtrend. Keep an eye on SP1500-451030 as it may be in the beginning of a reversal.
Is it time to buy, sell, or avoid SP1500-451030?
MarketClub looks at technical strength and momentum to determine if the timing is right for SP1500-451030.
Learn more about the Trade Triangles and how we make technical analysis as easy as buy and sell.
|
|||||||||||||||
|
|||||||||||||||
MarketClub’s Trade Triangles for SP1500-451030
![]() The long-term trend has been DOWN since Nov 7th, 2025 at 8350.88
The long-term trend has been DOWN since Nov 7th, 2025 at 8350.88
![]() The intermediate-term trend has been DOWN since Nov 4th, 2025 at 8733.05
The intermediate-term trend has been DOWN since Nov 4th, 2025 at 8733.05
![]() The short-term trend has been UP since Apr 1st, 2026 at 6256.54
The short-term trend has been UP since Apr 1st, 2026 at 6256.54
Smart Scan Analysis for SP1500-451030
Based on our trend formula, SP1500-451030 is rated as a -75 on a scale from -100 (Strong Downtrend) to +100 (Strong Uptrend).
| Open | High | Low | Price | Change |
|---|---|---|---|---|
| 6148.82 | 6267.55 | 6097.29 | 6267.55 | +57.51 |
| Prev. Close | Volume | Bid | Ask | Time |
| 6267.55 | 261646922 | 2026-04-02 16:19:12 |
| 52wk High | 2325.43 | 52wk High Date | 2018-10-01 |
| 52wk Low | 1656.77 | 52wk Low Date | 2017-12-06 |