Index Trend Analysis Report
Prepared for you on Tuesday, April 14, 2026.
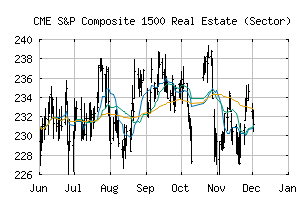
S&P Composite 1500 Real Estate (Sector) (CME:SP1500-60)
Strong Uptrend (+100) - SP1500-60 is in a strong uptrend that is likely to continue. With short-term, intermediate, and long-term bullish momentum, SP1500-60 continues to climb. Traders should protect gains and look for a change in score to suggest a slow down in momentum.
Is it time to buy, sell, or avoid SP1500-60?
MarketClub looks at technical strength and momentum to determine if the timing is right for SP1500-60.
Learn more about the Trade Triangles and how we make technical analysis as easy as buy and sell.
|
|||||||||||||||
|
|||||||||||||||
MarketClub’s Trade Triangles for SP1500-60
![]() The long-term trend has been UP since Feb 9th, 2026 at 239.03
The long-term trend has been UP since Feb 9th, 2026 at 239.03
![]() The intermediate-term trend has been UP since Apr 9th, 2026 at 242.59
The intermediate-term trend has been UP since Apr 9th, 2026 at 242.59
![]() The short-term trend has been UP since Mar 30th, 2026 at 230.51
The short-term trend has been UP since Mar 30th, 2026 at 230.51
Smart Scan Analysis for SP1500-60
Based on our trend formula, SP1500-60 is rated as a +100 on a scale from -100 (Strong Downtrend) to +100 (Strong Uptrend).
| Open | High | Low | Price | Change |
|---|---|---|---|---|
| 242.73 | 245.66 | 242.28 | 245.46 | +2.11 |
| Prev. Close | Volume | Bid | Ask | Time |
| 243.35 | 186220626 | 2026-04-14 16:17:24 |