Index Trend Analysis Report
Prepared for you on Thursday, March 26, 2026.
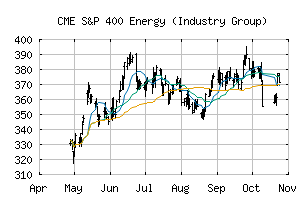
S&P 400 Energy (Industry Group) (CME:SP400-1010)
Strong Uptrend (+100) - SP400-1010 is in a strong uptrend that is likely to continue. With short-term, intermediate, and long-term bullish momentum, SP400-1010 continues to climb. Traders should protect gains and look for a change in score to suggest a slow down in momentum.
Is it time to buy, sell, or avoid SP400-1010?
MarketClub looks at technical strength and momentum to determine if the timing is right for SP400-1010.
Learn more about the Trade Triangles and how we make technical analysis as easy as buy and sell.
|
|||||||||||||||
|
|||||||||||||||
MarketClub’s Trade Triangles for SP400-1010
![]() The long-term trend has been UP since Sep 26th, 2025 at 391.39
The long-term trend has been UP since Sep 26th, 2025 at 391.39
![]() The intermediate-term trend has been UP since Jan 5th, 2026 at 401.82
The intermediate-term trend has been UP since Jan 5th, 2026 at 401.82
![]() The short-term trend has been UP since Mar 12th, 2026 at 498.05
The short-term trend has been UP since Mar 12th, 2026 at 498.05
Smart Scan Analysis for SP400-1010
Based on our trend formula, SP400-1010 is rated as a +100 on a scale from -100 (Strong Downtrend) to +100 (Strong Uptrend).
| Open | High | Low | Price | Change |
|---|---|---|---|---|
| 538.40 | 547.60 | 537.37 | 544.75 | +8.39 |
| Prev. Close | Volume | Bid | Ask | Time |
| 536.36 | 28402560 | 2026-03-26 14:36:20 |
| 52wk High | 530.67 | 52wk High Date | 2018-10-09 |
| 52wk Low | 345.53 | 52wk Low Date | 2018-02-09 |