Index Trend Analysis Report
Prepared for you on Wednesday, March 25, 2026.
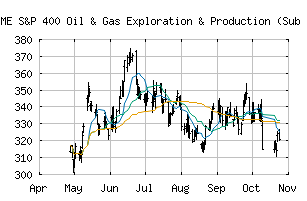
S&P 400 Oil & Gas Exploration & Production (Sub Ind) (CME:SP400-10102020)
Strong Uptrend (+100) - SP400-10102020 is in a strong uptrend that is likely to continue. With short-term, intermediate, and long-term bullish momentum, SP400-10102020 continues to climb. Traders should protect gains and look for a change in score to suggest a slow down in momentum.
Is it time to buy, sell, or avoid SP400-10102020?
MarketClub looks at technical strength and momentum to determine if the timing is right for SP400-10102020.
Learn more about the Trade Triangles and how we make technical analysis as easy as buy and sell.
|
|||||||||||||||
|
|||||||||||||||
MarketClub’s Trade Triangles for SP400-10102020
![]() The long-term trend has been UP since Dec 3rd, 2025 at 353.75
The long-term trend has been UP since Dec 3rd, 2025 at 353.75
![]() The intermediate-term trend has been UP since Jan 20th, 2026 at 341.15
The intermediate-term trend has been UP since Jan 20th, 2026 at 341.15
![]() The short-term trend has been UP since Mar 12th, 2026 at 421.22
The short-term trend has been UP since Mar 12th, 2026 at 421.22
Smart Scan Analysis for SP400-10102020
Based on our trend formula, SP400-10102020 is rated as a +100 on a scale from -100 (Strong Downtrend) to +100 (Strong Uptrend).
| Open | High | Low | Price | Change |
|---|---|---|---|---|
| 446.74 | 454.25 | 446.74 | 452.74 | +0.82 |
| Prev. Close | Volume | Bid | Ask | Time |
| 451.92 | 5537915 | 2026-03-25 10:42:54 |
| 52wk High | 308.06 | 52wk High Date | 2018-10-09 |
| 52wk Low | 197.61 | 52wk Low Date | 2018-02-09 |