Index Trend Analysis Report
Prepared for you on Tuesday, March 10, 2026.
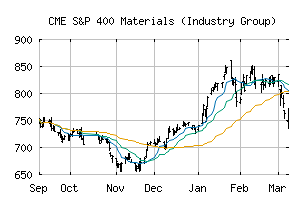
S&P 400 Materials (Industry Group) (CME:SP400-1510)
Crossroads (-60) - SP400-1510 is struggling to move into a solid trend. Beware of choppy markets and consider a sidelines position until a stronger trend is identified.
Is it time to buy, sell, or avoid SP400-1510?
MarketClub looks at technical strength and momentum to determine if the timing is right for SP400-1510.
Learn more about the Trade Triangles and how we make technical analysis as easy as buy and sell.
|
|||||||||||||||
|
|||||||||||||||
MarketClub’s Trade Triangles for SP400-1510
![]() The long-term trend has been UP since Jan 5th, 2026 at 747.25
The long-term trend has been UP since Jan 5th, 2026 at 747.25
![]() The intermediate-term trend has been DOWN since Mar 3rd, 2026 at 802.24
The intermediate-term trend has been DOWN since Mar 3rd, 2026 at 802.24
![]() The short-term trend has been DOWN since Mar 3rd, 2026 at 813.15
The short-term trend has been DOWN since Mar 3rd, 2026 at 813.15
Smart Scan Analysis for SP400-1510
Based on our trend formula, SP400-1510 is rated as a -60 on a scale from -100 (Strong Downtrend) to +100 (Strong Uptrend).
| Open | High | Low | Price | Change |
|---|---|---|---|---|
| 748.01 | 771.51 | 735.40 | 768.13 | +4.44 |
| Prev. Close | Volume | Bid | Ask | Time |
| 768.13 | 83208994 | 2026-03-09 16:19:09 |
| 52wk High | 545.11 | 52wk High Date | 2018-01-26 |
| 52wk Low | 424.25 | 52wk Low Date | 2018-10-29 |