Index Trend Analysis Report
Prepared for you on Tuesday, April 14, 2026.
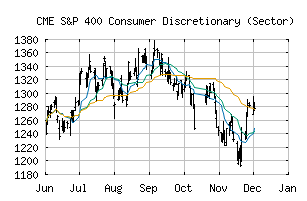
S&P 400 Consumer Discretionary (Sector) (CME:SP400-25)
Crossroads (+60) - SP400-25 is struggling to move into a solid trend. Beware of choppy markets and consider a sidelines position until a stronger trend is identified.
Is it time to buy, sell, or avoid SP400-25?
MarketClub looks at technical strength and momentum to determine if the timing is right for SP400-25.
Learn more about the Trade Triangles and how we make technical analysis as easy as buy and sell.
|
|||||||||||||||
|
|||||||||||||||
MarketClub’s Trade Triangles for SP400-25
![]() The long-term trend has been DOWN since Mar 2nd, 2026 at 1268.66
The long-term trend has been DOWN since Mar 2nd, 2026 at 1268.66
![]() The intermediate-term trend has been UP since Apr 8th, 2026 at 1218.65
The intermediate-term trend has been UP since Apr 8th, 2026 at 1218.65
![]() The short-term trend has been UP since Apr 14th, 2026 at 1255.56
The short-term trend has been UP since Apr 14th, 2026 at 1255.56
Smart Scan Analysis for SP400-25
Based on our trend formula, SP400-25 is rated as a +60 on a scale from -100 (Strong Downtrend) to +100 (Strong Uptrend).
| Open | High | Low | Price | Change |
|---|---|---|---|---|
| 1247.16 | 1261.96 | 1245.63 | 1256.84 | +13.05 |
| Prev. Close | Volume | Bid | Ask | Time |
| 1243.79 | 117964001 | 2026-04-14 16:17:24 |
| 52wk High | 848.95 | 52wk High Date | 2018-01-24 |
| 52wk Low | 686.56 | 52wk Low Date | 2018-10-26 |