Index Trend Analysis Report
Prepared for you on Sunday, August 31, 2025.
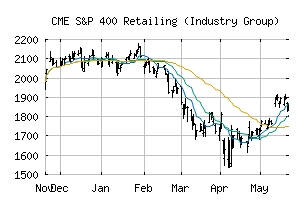
S&P 400 Retailing (Industry Group) (CME:SP400-2550)
Countertrend Up (+85) - SP400-2550 is showing short-term weakness. However, look for the longer-term bullish trend to resume. As always, continue to monitor the trend score and utilize a stop order.
Is it time to buy, sell, or avoid SP400-2550?
MarketClub looks at technical strength and momentum to determine if the timing is right for SP400-2550.
Learn more about the Trade Triangles and how we make technical analysis as easy as buy and sell.
|
|||||||||||||||
|
|||||||||||||||
MarketClub’s Trade Triangles for SP400-2550
![]() The long-term trend has been UP since Jul 3rd, 2025 at 1915.31
The long-term trend has been UP since Jul 3rd, 2025 at 1915.31
![]() The intermediate-term trend has been UP since Aug 13th, 2025 at 1940.05
The intermediate-term trend has been UP since Aug 13th, 2025 at 1940.05
![]() The short-term trend has been DOWN since Aug 29th, 2025 at 1938.48
The short-term trend has been DOWN since Aug 29th, 2025 at 1938.48
Smart Scan Analysis for SP400-2550
Based on our trend formula, SP400-2550 is rated as a +85 on a scale from -100 (Strong Downtrend) to +100 (Strong Uptrend).
| Open | High | Low | Price | Change |
|---|---|---|---|---|
| 1964.41 | 1965.49 | 1923.09 | 1933.45 | -27.50 |
| Prev. Close | Volume | Bid | Ask | Time |
| 1933.45 | 68581983 | 2025-08-29 16:19:09 |
| 52wk High | 1167.52 | 52wk High Date | 2018-09-11 |
| 52wk Low | 888.16 | 52wk Low Date | 2018-05-07 |