Index Trend Analysis Report
Prepared for you on Tuesday, March 24, 2026.
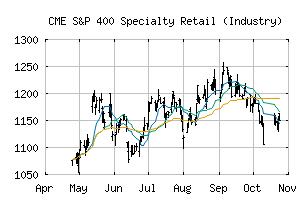
S&P 400 Specialty Retail (Industry) (CME:SP400-255040)
Countertrend Down (-85) - SP400-255040 is showing short-term strength. However, look for the longer-term bearish trend to resume. As always, continue to monitor the trend score and set stops.
Is it time to buy, sell, or avoid SP400-255040?
MarketClub looks at technical strength and momentum to determine if the timing is right for SP400-255040.
Learn more about the Trade Triangles and how we make technical analysis as easy as buy and sell.
|
|||||||||||||||
|
|||||||||||||||
MarketClub’s Trade Triangles for SP400-255040
![]() The long-term trend has been DOWN since Mar 19th, 2026 at 1098.05
The long-term trend has been DOWN since Mar 19th, 2026 at 1098.05
![]() The intermediate-term trend has been DOWN since Mar 2nd, 2026 at 1156.85
The intermediate-term trend has been DOWN since Mar 2nd, 2026 at 1156.85
![]() The short-term trend has been UP since Mar 23rd, 2026 at 1134.44
The short-term trend has been UP since Mar 23rd, 2026 at 1134.44
Smart Scan Analysis for SP400-255040
Based on our trend formula, SP400-255040 is rated as a -85 on a scale from -100 (Strong Downtrend) to +100 (Strong Uptrend).
| Open | High | Low | Price | Change |
|---|---|---|---|---|
| 1116.35 | 1118.94 | 1109.14 | 1118.94 | -5.36 |
| Prev. Close | Volume | Bid | Ask | Time |
| 1124.30 | 4650588 | 2026-03-24 10:14:54 |
| 52wk High | 747.44 | 52wk High Date | 2018-08-23 |
| 52wk Low | 559.3 | 52wk Low Date | 2018-05-07 |