Index Trend Analysis Report
Prepared for you on Saturday, April 18, 2026.
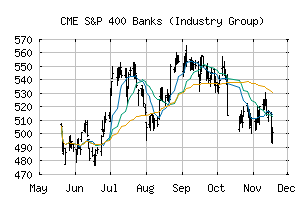
S&P 400 Banks (Industry Group) (CME:SP400-4010)
Crossroads (+60) - SP400-4010 is struggling to move into a solid trend. Beware of choppy markets and consider a sidelines position until a stronger trend is identified.
Is it time to buy, sell, or avoid SP400-4010?
MarketClub looks at technical strength and momentum to determine if the timing is right for SP400-4010.
Learn more about the Trade Triangles and how we make technical analysis as easy as buy and sell.
|
|||||||||||||||
|
|||||||||||||||
MarketClub’s Trade Triangles for SP400-4010
![]() The long-term trend has been DOWN since Mar 6th, 2026 at 530.46
The long-term trend has been DOWN since Mar 6th, 2026 at 530.46
![]() The intermediate-term trend has been UP since Apr 1st, 2026 at 551.02
The intermediate-term trend has been UP since Apr 1st, 2026 at 551.02
![]() The short-term trend has been UP since Mar 31st, 2026 at 540.45
The short-term trend has been UP since Mar 31st, 2026 at 540.45
Smart Scan Analysis for SP400-4010
Based on our trend formula, SP400-4010 is rated as a +60 on a scale from -100 (Strong Downtrend) to +100 (Strong Uptrend).
| Open | High | Low | Price | Change |
|---|---|---|---|---|
| 581.15 | 594.63 | 580.41 | 586.81 | +13.40 |
| Prev. Close | Volume | Bid | Ask | Time |
| 586.81 | 64917187 | 2026-04-17 16:19:20 |
| 52wk High | 508.63 | 52wk High Date | 2018-06-07 |
| 52wk Low | 380.24 | 52wk Low Date | 2018-10-24 |