Index Trend Analysis Report
Prepared for you on Tuesday, March 24, 2026.
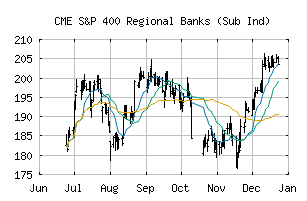
S&P 400 Regional Banks (Sub Ind) (CME:SP400-40101015)
Countertrend Down (-85) - SP400-40101015 is showing short-term strength. However, look for the longer-term bearish trend to resume. As always, continue to monitor the trend score and set stops.
Is it time to buy, sell, or avoid SP400-40101015?
MarketClub looks at technical strength and momentum to determine if the timing is right for SP400-40101015.
Learn more about the Trade Triangles and how we make technical analysis as easy as buy and sell.
|
|||||||||||||||
|
|||||||||||||||
MarketClub’s Trade Triangles for SP400-40101015
![]() The long-term trend has been DOWN since Mar 6th, 2026 at 190.19
The long-term trend has been DOWN since Mar 6th, 2026 at 190.19
![]() The intermediate-term trend has been DOWN since Feb 24th, 2026 at 206.64
The intermediate-term trend has been DOWN since Feb 24th, 2026 at 206.64
![]() The short-term trend has been UP since Mar 23rd, 2026 at 188.69
The short-term trend has been UP since Mar 23rd, 2026 at 188.69
Smart Scan Analysis for SP400-40101015
Based on our trend formula, SP400-40101015 is rated as a -85 on a scale from -100 (Strong Downtrend) to +100 (Strong Uptrend).
| Open | High | Low | Price | Change |
|---|---|---|---|---|
| 188.78 | 194.13 | 188.76 | 192.16 | +1.69 |
| Prev. Close | Volume | Bid | Ask | Time |
| 190.47 | 57523604 | 2026-03-24 16:20:09 |
| 52wk High | 182.79 | 52wk High Date | 2018-06-07 |
| 52wk Low | 136.54 | 52wk Low Date | 2018-10-24 |