Index Trend Analysis Report
Prepared for you on Wednesday, July 2, 2025.
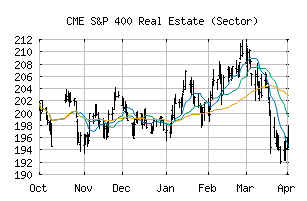
S&P 400 Real Estate (Sector) (CME:SP400-60)
Weak Downtrend (-65) - SP400-60 is showing signs of a strengthening downtrend. Monitor SP400-60 as it may be building momentum to the downside.
Is it time to buy, sell, or avoid SP400-60?
MarketClub looks at technical strength and momentum to determine if the timing is right for SP400-60.
Learn more about the Trade Triangles and how we make technical analysis as easy as buy and sell.
|
|||||||||||||||
|
|||||||||||||||
MarketClub’s Trade Triangles for SP400-60
![]() The long-term trend has been DOWN since Dec 18th, 2024 at 203.58
The long-term trend has been DOWN since Dec 18th, 2024 at 203.58
![]() The intermediate-term trend has been DOWN since Jun 30th, 2025 at 191.29
The intermediate-term trend has been DOWN since Jun 30th, 2025 at 191.29
![]() The short-term trend has been UP since Jul 1st, 2025 at 195.26
The short-term trend has been UP since Jul 1st, 2025 at 195.26
Smart Scan Analysis for SP400-60
Based on our trend formula, SP400-60 is rated as a -65 on a scale from -100 (Strong Downtrend) to +100 (Strong Uptrend).
| Open | High | Low | Price | Change |
|---|---|---|---|---|
| 192.40 | 196.72 | 192.28 | 194.13 | +1.06 |
| Prev. Close | Volume | Bid | Ask | Time |
| 194.13 | 55652335 | 2025-07-01 16:20:09 |
| 52wk High | 264.79 | 52wk High Date | 2017-12-06 |
| 52wk Low | 198.32 | 52wk Low Date | 2018-02-12 |