Index Trend Analysis Report
Prepared for you on Tuesday, April 14, 2026.
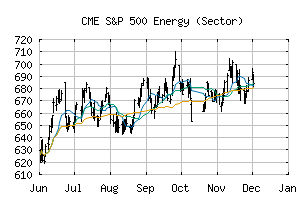
S&P 500 Energy (Sector) (CME:SP500-10)
Crossroads (-60) - SP500-10 is struggling to move into a solid trend. Beware of choppy markets and consider a sidelines position until a stronger trend is identified.
Is it time to buy, sell, or avoid SP500-10?
MarketClub looks at technical strength and momentum to determine if the timing is right for SP500-10.
Learn more about the Trade Triangles and how we make technical analysis as easy as buy and sell.
|
|||||||||||||||
|
|||||||||||||||
MarketClub’s Trade Triangles for SP500-10
![]() The long-term trend has been UP since Aug 29th, 2025 at 685.27
The long-term trend has been UP since Aug 29th, 2025 at 685.27
![]() The intermediate-term trend has been DOWN since Apr 8th, 2026 at 875.29
The intermediate-term trend has been DOWN since Apr 8th, 2026 at 875.29
![]() The short-term trend has been DOWN since Mar 31st, 2026 at 929.64
The short-term trend has been DOWN since Mar 31st, 2026 at 929.64
Smart Scan Analysis for SP500-10
Based on our trend formula, SP500-10 is rated as a -60 on a scale from -100 (Strong Downtrend) to +100 (Strong Uptrend).
| Open | High | Low | Price | Change |
|---|---|---|---|---|
| 865.38 | 865.78 | 849.23 | 857.69 | -18.92 |
| Prev. Close | Volume | Bid | Ask | Time |
| 876.61 | 159054359 | 2026-04-14 16:17:18 |
| 52wk High | 583.43 | 52wk High Date | 2018-05-22 |
| 52wk Low | 466.92 | 52wk Low Date | 2018-11-23 |