Index Trend Analysis Report
Prepared for you on Monday, April 20, 2026.
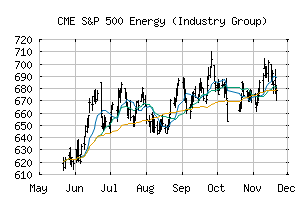
S&P 500 Energy (Industry Group) (CME:SP500-1010)
Weak Downtrend (-65) - SP500-1010 is showing signs of a strengthening downtrend. Monitor SP500-1010 as it may be building momentum to the downside.
Is it time to buy, sell, or avoid SP500-1010?
MarketClub looks at technical strength and momentum to determine if the timing is right for SP500-1010.
Learn more about the Trade Triangles and how we make technical analysis as easy as buy and sell.
|
|||||||||||||||
|
|||||||||||||||
MarketClub’s Trade Triangles for SP500-1010
![]() The long-term trend has been UP since Aug 29th, 2025 at 685.25
The long-term trend has been UP since Aug 29th, 2025 at 685.25
![]() The intermediate-term trend has been DOWN since Apr 8th, 2026 at 875.63
The intermediate-term trend has been DOWN since Apr 8th, 2026 at 875.63
![]() The short-term trend has been DOWN since Mar 31st, 2026 at 929.87
The short-term trend has been DOWN since Mar 31st, 2026 at 929.87
Smart Scan Analysis for SP500-1010
Based on our trend formula, SP500-1010 is rated as a -70 on a scale from -100 (Strong Downtrend) to +100 (Strong Uptrend).
| Open | High | Low | Price | Change |
|---|---|---|---|---|
| 844.16 | 854.12 | 841.29 | 844.78 | +1.80 |
| Prev. Close | Volume | Bid | Ask | Time |
| 842.98 | 155988096 | 2026-04-20 16:06:53 |
| 52wk High | 583.42 | 52wk High Date | 2018-05-22 |
| 52wk Low | 466.97 | 52wk Low Date | 2018-11-23 |