Index Trend Analysis Report
Prepared for you on Friday, March 20, 2026.
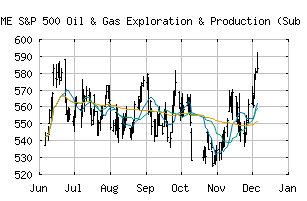
S&P 500 Oil & Gas Exploration & Production (Sub Ind) (CME:SP500-10102020)
Long-Term Uptrend (+90) - SP500-10102020 is in a strong uptrend that is likely to continue. While SP500-10102020 is showing intraday weakness, it remains in the confines of a bullish trend. Traders should use caution and utilize a stop order.
Is it time to buy, sell, or avoid SP500-10102020?
MarketClub looks at technical strength and momentum to determine if the timing is right for SP500-10102020.
Learn more about the Trade Triangles and how we make technical analysis as easy as buy and sell.
|
|||||||||||||||
|
|||||||||||||||
MarketClub’s Trade Triangles for SP500-10102020
![]() The long-term trend has been UP since Dec 4th, 2025 at 581.40
The long-term trend has been UP since Dec 4th, 2025 at 581.40
![]() The intermediate-term trend has been UP since Nov 6th, 2025 at 545.70
The intermediate-term trend has been UP since Nov 6th, 2025 at 545.70
![]() The short-term trend has been UP since Mar 12th, 2026 at 701.46
The short-term trend has been UP since Mar 12th, 2026 at 701.46
Smart Scan Analysis for SP500-10102020
Based on our trend formula, SP500-10102020 is rated as a +90 on a scale from -100 (Strong Downtrend) to +100 (Strong Uptrend).
| Open | High | Low | Price | Change |
|---|---|---|---|---|
| 733.91 | 743.39 | 729.64 | 734.71 | +3.22 |
| Prev. Close | Volume | Bid | Ask | Time |
| 731.49 | 56023155 | 2026-03-20 15:26:08 |
| 52wk High | 514.43 | 52wk High Date | 2018-10-09 |
| 52wk Low | 376.22 | 52wk Low Date | 2018-02-09 |