Index Trend Analysis Report
Prepared for you on Monday, June 30, 2025.
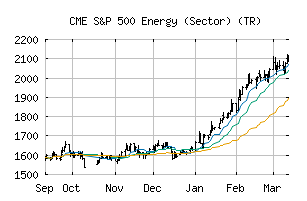
S&P 500 Energy (Sector) (TR) (CME:SP500-10TR)
Sidelines Mode (-55) - SP500-10TR is moving in a sideways pattern and is unable to gain momentum in either direction. Beware of choppy movement and consider a sidelines position until a stronger trend is identified.
Is it time to buy, sell, or avoid SP500-10TR?
MarketClub looks at technical strength and momentum to determine if the timing is right for SP500-10TR.
Learn more about the Trade Triangles and how we make technical analysis as easy as buy and sell.
|
|||||||||||||||
|
|||||||||||||||
MarketClub’s Trade Triangles for SP500-10TR
![]() The long-term trend has been DOWN since Apr 4th, 2025 at 1471.77
The long-term trend has been DOWN since Apr 4th, 2025 at 1471.77
![]() The intermediate-term trend has been UP since Apr 28th, 2025 at 1473.34
The intermediate-term trend has been UP since Apr 28th, 2025 at 1473.34
![]() The short-term trend has been DOWN since Jun 23rd, 2025 at 1555.44
The short-term trend has been DOWN since Jun 23rd, 2025 at 1555.44
Smart Scan Analysis for SP500-10TR
Based on our trend formula, SP500-10TR is rated as a -55 on a scale from -100 (Strong Downtrend) to +100 (Strong Uptrend).
| Open | High | Low | Price | Change |
|---|---|---|---|---|
| 1522.72 | 1522.72 | 1509.41 | 1512.64 | -10.08 |
| Prev. Close | Volume | Bid | Ask | Time |
| 1522.72 | 0 | 2025-06-30 16:20:03 |
| 52wk High | 1027.85 | 52wk High Date | 2018-10-09 |
| 52wk Low | 826.8 | 52wk Low Date | 2018-02-09 |