Index Trend Analysis Report
Prepared for you on Sunday, August 31, 2025.
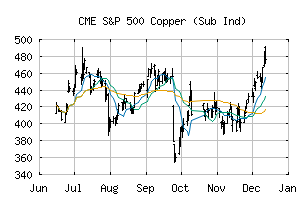
S&P 500 Copper (Sub Ind) (CME:SP500-15104025)
Strong Uptrend (+100) - SP500-15104025 is in a strong uptrend that is likely to continue. With short-term, intermediate, and long-term bullish momentum, SP500-15104025 continues to climb. Traders should protect gains and look for a change in score to suggest a slow down in momentum.
Is it time to buy, sell, or avoid SP500-15104025?
MarketClub looks at technical strength and momentum to determine if the timing is right for SP500-15104025.
Learn more about the Trade Triangles and how we make technical analysis as easy as buy and sell.
|
|||||||||||||||
|
|||||||||||||||
MarketClub’s Trade Triangles for SP500-15104025
![]() The long-term trend has been UP since Jun 26th, 2025 at 435.41
The long-term trend has been UP since Jun 26th, 2025 at 435.41
![]() The intermediate-term trend has been UP since Aug 25th, 2025 at 436.92
The intermediate-term trend has been UP since Aug 25th, 2025 at 436.92
![]() The short-term trend has been UP since Aug 22nd, 2025 at 422.13
The short-term trend has been UP since Aug 22nd, 2025 at 422.13
Smart Scan Analysis for SP500-15104025
Based on our trend formula, SP500-15104025 is rated as a +100 on a scale from -100 (Strong Downtrend) to +100 (Strong Uptrend).
| Open | High | Low | Price | Change |
|---|---|---|---|---|
| 446.38 | 449.90 | 443.96 | 446.68 | +0.30 |
| Prev. Close | Volume | Bid | Ask | Time |
| 446.68 | 7357964 | 2025-08-29 16:19:09 |
| 52wk High | 202.97 | 52wk High Date | 2018-01-22 |
| 52wk Low | 106.54 | 52wk Low Date | 2018-10-24 |