Index Trend Analysis Report
Prepared for you on Wednesday, March 25, 2026.
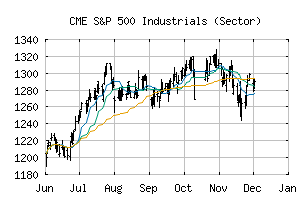
S&P 500 Industrials (Sector) (CME:SP500-20)
Sidelines Mode (-55) - SP500-20 is moving in a sideways pattern and is unable to gain momentum in either direction. Beware of choppy movement and consider a sidelines position until a stronger trend is identified.
Is it time to buy, sell, or avoid SP500-20?
MarketClub looks at technical strength and momentum to determine if the timing is right for SP500-20.
Learn more about the Trade Triangles and how we make technical analysis as easy as buy and sell.
|
|||||||||||||||
|
|||||||||||||||
MarketClub’s Trade Triangles for SP500-20
![]() The long-term trend has been UP since Dec 11th, 2025 at 1328.04
The long-term trend has been UP since Dec 11th, 2025 at 1328.04
![]() The intermediate-term trend has been DOWN since Mar 5th, 2026 at 1459.32
The intermediate-term trend has been DOWN since Mar 5th, 2026 at 1459.32
![]() The short-term trend has been UP since Mar 25th, 2026 at 1407.06
The short-term trend has been UP since Mar 25th, 2026 at 1407.06
Smart Scan Analysis for SP500-20
Based on our trend formula, SP500-20 is rated as a -55 on a scale from -100 (Strong Downtrend) to +100 (Strong Uptrend).
| Open | High | Low | Price | Change |
|---|---|---|---|---|
| 1406.26 | 1407.47 | 1391.89 | 1398.13 | +9.42 |
| Prev. Close | Volume | Bid | Ask | Time |
| 1388.71 | 199009909 | 2026-03-25 16:44:44 |
| 52wk High | 680.89 | 52wk High Date | 2018-01-29 |
| 52wk Low | 563.06 | 52wk Low Date | 2018-10-29 |