Index Trend Analysis Report
Prepared for you on Monday, March 16, 2026.
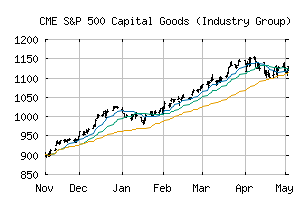
S&P 500 Capital Goods (Industry Group) (CME:SP500-2010)
Weak Downtrend (-65) - SP500-2010 is showing signs of a strengthening downtrend. Monitor SP500-2010 as it may be building momentum to the downside.
Is it time to buy, sell, or avoid SP500-2010?
MarketClub looks at technical strength and momentum to determine if the timing is right for SP500-2010.
Learn more about the Trade Triangles and how we make technical analysis as easy as buy and sell.
|
|||||||||||||||
|
|||||||||||||||
MarketClub’s Trade Triangles for SP500-2010
![]() The long-term trend has been UP since May 12th, 2025 at 1296.49
The long-term trend has been UP since May 12th, 2025 at 1296.49
![]() The intermediate-term trend has been DOWN since Mar 5th, 2026 at 1761.65
The intermediate-term trend has been DOWN since Mar 5th, 2026 at 1761.65
![]() The short-term trend has been DOWN since Mar 3rd, 2026 at 1772.90
The short-term trend has been DOWN since Mar 3rd, 2026 at 1772.90
Smart Scan Analysis for SP500-2010
Based on our trend formula, SP500-2010 is rated as a -70 on a scale from -100 (Strong Downtrend) to +100 (Strong Uptrend).
| Open | High | Low | Price | Change |
|---|---|---|---|---|
| 1702.74 | 1711.12 | 1672.93 | 1684.04 | -9.28 |
| Prev. Close | Volume | Bid | Ask | Time |
| 1684.04 | 106471421 | 2026-03-13 16:19:23 |
| 52wk High | 739.39 | 52wk High Date | 2018-01-29 |
| 52wk Low | 587.07 | 52wk Low Date | 2018-10-29 |