Index Trend Analysis Report
Prepared for you on Friday, April 19, 2024.
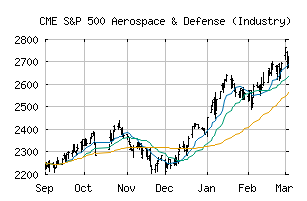
S&P 500 Aerospace & Defense (Industry) (CME:SP500-201010)
Sidelines Mode (+55) - SP500-201010 is moving in a sideways pattern and is unable to gain momentum in either direction. Beware of choppy movement and consider a sidelines position until a stronger trend is identified.
Is it time to buy, sell, or avoid SP500-201010?
MarketClub looks at technical strength and momentum to determine if the timing is right for SP500-201010.
Learn more about the Trade Triangles and how we make technical analysis as easy as buy and sell.
|
|||||||||||||||
|
|||||||||||||||
MarketClub’s Trade Triangles for SP500-201010
![]() The long-term trend has been UP since Nov 30th, 2023 at 1428.87
The long-term trend has been UP since Nov 30th, 2023 at 1428.87
![]() The intermediate-term trend has been UP since Mar 20th, 2024 at 1509.22
The intermediate-term trend has been UP since Mar 20th, 2024 at 1509.22
![]() The short-term trend has been DOWN since Apr 10th, 2024 at 1548.76
The short-term trend has been DOWN since Apr 10th, 2024 at 1548.76
Smart Scan Analysis for SP500-201010
Based on our trend formula, SP500-201010 is rated as a +55 on a scale from -100 (Strong Downtrend) to +100 (Strong Uptrend).
| Open | High | Low | Price | Change |
|---|---|---|---|---|
| 1547.52 | 1560.34 | 1539.83 | 1540.00 | -6.64 |
| Prev. Close | Volume | Bid | Ask | Time |
| 1540.00 | 21860988 | 2024-04-18 16:19:49 |
| 52wk High | 1362.75 | 52wk High Date | 2018-10-03 |
| 52wk Low | 1119.49 | 52wk Low Date | 2018-10-29 |