Index Trend Analysis Report
Prepared for you on Wednesday, April 1, 2026.
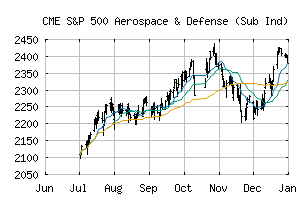
S&P 500 Aerospace & Defense (Sub Ind) (CME:SP500-20101010)
Sidelines Mode (-55) - SP500-20101010 is moving in a sideways pattern and is unable to gain momentum in either direction. Beware of choppy movement and consider a sidelines position until a stronger trend is identified.
Is it time to buy, sell, or avoid SP500-20101010?
MarketClub looks at technical strength and momentum to determine if the timing is right for SP500-20101010.
Learn more about the Trade Triangles and how we make technical analysis as easy as buy and sell.
|
|||||||||||||||
|
|||||||||||||||
MarketClub’s Trade Triangles for SP500-20101010
![]() The long-term trend has been UP since May 2nd, 2025 at 1884.21
The long-term trend has been UP since May 2nd, 2025 at 1884.21
![]() The intermediate-term trend has been DOWN since Mar 12th, 2026 at 2606.12
The intermediate-term trend has been DOWN since Mar 12th, 2026 at 2606.12
![]() The short-term trend has been UP since Apr 1st, 2026 at 2418.57
The short-term trend has been UP since Apr 1st, 2026 at 2418.57
Smart Scan Analysis for SP500-20101010
Based on our trend formula, SP500-20101010 is rated as a -55 on a scale from -100 (Strong Downtrend) to +100 (Strong Uptrend).
| Open | High | Low | Price | Change |
|---|---|---|---|---|
| 2440.63 | 2482.14 | 2437.82 | 2466.94 | +60.74 |
| Prev. Close | Volume | Bid | Ask | Time |
| 2406.20 | 17406303 | 2026-04-01 14:30:47 |
| 52wk High | 1362.75 | 52wk High Date | 2018-10-03 |
| 52wk Low | 1119.49 | 52wk Low Date | 2018-10-29 |