Index Trend Analysis Report
Prepared for you on Saturday, July 5, 2025.
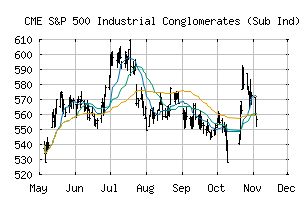
S&P 500 Industrial Conglomerates (Sub Ind) (CME:SP500-20105010)
Long-Term Uptrend (+90) - SP500-20105010 is in a strong uptrend that is likely to continue. While SP500-20105010 is showing intraday weakness, it remains in the confines of a bullish trend. Traders should use caution and utilize a stop order.
Is it time to buy, sell, or avoid SP500-20105010?
MarketClub looks at technical strength and momentum to determine if the timing is right for SP500-20105010.
Learn more about the Trade Triangles and how we make technical analysis as easy as buy and sell.
|
|||||||||||||||
|
|||||||||||||||
MarketClub’s Trade Triangles for SP500-20105010
![]() The long-term trend has been UP since May 19th, 2025 at 573.68
The long-term trend has been UP since May 19th, 2025 at 573.68
![]() The intermediate-term trend has been UP since Jun 27th, 2025 at 575.51
The intermediate-term trend has been UP since Jun 27th, 2025 at 575.51
![]() The short-term trend has been UP since Jun 23rd, 2025 at 559.94
The short-term trend has been UP since Jun 23rd, 2025 at 559.94
Smart Scan Analysis for SP500-20105010
Based on our trend formula, SP500-20105010 is rated as a +90 on a scale from -100 (Strong Downtrend) to +100 (Strong Uptrend).
| Open | High | Low | Price | Change |
|---|---|---|---|---|
| 598.86 | 601.89 | 592.82 | 598.05 | +0.45 |
| Prev. Close | Volume | Bid | Ask | Time |
| 598.05 | 5077419 | 2025-07-03 13:19:38 |
| 52wk High | 397.22 | 52wk High Date | 2018-01-12 |
| 52wk Low | 277.93 | 52wk Low Date | 2018-11-26 |