Index Trend Analysis Report
Prepared for you on Saturday, March 14, 2026.
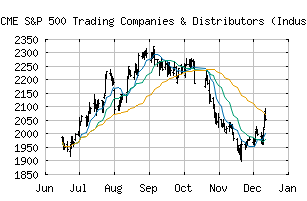
S&P 500 Trading Companies & Distributors (Industry) (CME:SP500-201070)
Crossroads (-60) - SP500-201070 is struggling to move into a solid trend. Beware of choppy markets and consider a sidelines position until a stronger trend is identified.
Is it time to buy, sell, or avoid SP500-201070?
MarketClub looks at technical strength and momentum to determine if the timing is right for SP500-201070.
Learn more about the Trade Triangles and how we make technical analysis as easy as buy and sell.
|
|||||||||||||||
|
|||||||||||||||
MarketClub’s Trade Triangles for SP500-201070
![]() The long-term trend has been UP since Feb 4th, 2026 at 2256.76
The long-term trend has been UP since Feb 4th, 2026 at 2256.76
![]() The intermediate-term trend has been DOWN since Mar 3rd, 2026 at 2161.20
The intermediate-term trend has been DOWN since Mar 3rd, 2026 at 2161.20
![]() The short-term trend has been DOWN since Mar 9th, 2026 at 2164.03
The short-term trend has been DOWN since Mar 9th, 2026 at 2164.03
Smart Scan Analysis for SP500-201070
Based on our trend formula, SP500-201070 is rated as a -60 on a scale from -100 (Strong Downtrend) to +100 (Strong Uptrend).
| Open | High | Low | Price | Change |
|---|---|---|---|---|
| 2080.45 | 2091.46 | 2047.44 | 2069.55 | +1.37 |
| Prev. Close | Volume | Bid | Ask | Time |
| 2069.55 | 7182556 | 2026-03-13 16:19:38 |
| 52wk High | 616.7 | 52wk High Date | 2018-08-21 |
| 52wk Low | 452.75 | 52wk Low Date | 2018-10-26 |