Index Trend Analysis Report
Prepared for you on Saturday, October 26, 2024.
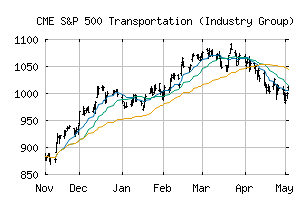
S&P 500 Transportation (Industry Group) (CME:SP500-2030)
Sidelines Mode (+55) - SP500-2030 is moving in a sideways pattern and is unable to gain momentum in either direction. Beware of choppy movement and consider a sidelines position until a stronger trend is identified.
Is it time to buy, sell, or avoid SP500-2030?
MarketClub looks at technical strength and momentum to determine if the timing is right for SP500-2030.
Learn more about the Trade Triangles and how we make technical analysis as easy as buy and sell.
|
|||||||||||||||
|
|||||||||||||||
MarketClub’s Trade Triangles for SP500-2030
![]() The long-term trend has been UP since Sep 19th, 2024 at 1047.68
The long-term trend has been UP since Sep 19th, 2024 at 1047.68
![]() The intermediate-term trend has been UP since Oct 11th, 2024 at 1051.44
The intermediate-term trend has been UP since Oct 11th, 2024 at 1051.44
![]() The short-term trend has been DOWN since Oct 17th, 2024 at 1061.72
The short-term trend has been DOWN since Oct 17th, 2024 at 1061.72
Smart Scan Analysis for SP500-2030
Based on our trend formula, SP500-2030 is rated as a +55 on a scale from -100 (Strong Downtrend) to +100 (Strong Uptrend).
| Open | High | Low | Price | Change |
|---|---|---|---|---|
| 1047.29 | 1050.45 | 1039.06 | 1041.99 | -2.51 |
| Prev. Close | Volume | Bid | Ask | Time |
| 1041.99 | 62258670 | 2024-10-25 16:20:08 |
| 52wk High | 820.95 | 52wk High Date | 2018-09-21 |
| 52wk Low | 653.83 | 52wk Low Date | 2018-02-09 |