Index Trend Analysis Report
Prepared for you on Tuesday, April 14, 2026.
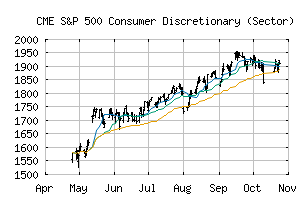
S&P 500 Consumer Discretionary (Sector) (CME:SP500-25)
Crossroads (+60) - SP500-25 is struggling to move into a solid trend. Beware of choppy markets and consider a sidelines position until a stronger trend is identified.
Is it time to buy, sell, or avoid SP500-25?
MarketClub looks at technical strength and momentum to determine if the timing is right for SP500-25.
Learn more about the Trade Triangles and how we make technical analysis as easy as buy and sell.
|
|||||||||||||||
|
|||||||||||||||
MarketClub’s Trade Triangles for SP500-25
![]() The long-term trend has been DOWN since Mar 2nd, 2026 at 1805.92
The long-term trend has been DOWN since Mar 2nd, 2026 at 1805.92
![]() The intermediate-term trend has been UP since Apr 9th, 2026 at 1818.45
The intermediate-term trend has been UP since Apr 9th, 2026 at 1818.45
![]() The short-term trend has been UP since Apr 8th, 2026 at 1759.11
The short-term trend has been UP since Apr 8th, 2026 at 1759.11
Smart Scan Analysis for SP500-25
Based on our trend formula, SP500-25 is rated as a +60 on a scale from -100 (Strong Downtrend) to +100 (Strong Uptrend).
| Open | High | Low | Price | Change |
|---|---|---|---|---|
| 1868.30 | 1911.80 | 1868.30 | 1901.85 | +47.17 |
| Prev. Close | Volume | Bid | Ask | Time |
| 1854.68 | 343503522 | 2026-04-14 16:17:19 |
| 52wk High | 946.29 | 52wk High Date | 2018-10-01 |
| 52wk Low | 756.85 | 52wk Low Date | 2017-12-01 |