Index Trend Analysis Report
Prepared for you on Wednesday, April 8, 2026.
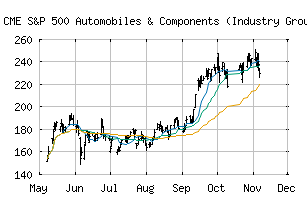
S&P 500 Automobiles & Components (Industry Group) (CME:SP500-2510)
Strong Downtrend (-100) - SP500-2510 is in a strong downtrend that is likely to continue. With short-term, intermediate, and long-term bearish momentum, SP500-2510 continues to fall. Traders should use caution and set stops.
Is it time to buy, sell, or avoid SP500-2510?
MarketClub looks at technical strength and momentum to determine if the timing is right for SP500-2510.
Learn more about the Trade Triangles and how we make technical analysis as easy as buy and sell.
|
|||||||||||||||
|
|||||||||||||||
MarketClub’s Trade Triangles for SP500-2510
![]() The long-term trend has been DOWN since Mar 2nd, 2026 at 212.28
The long-term trend has been DOWN since Mar 2nd, 2026 at 212.28
![]() The intermediate-term trend has been DOWN since Jan 6th, 2026 at 234.40
The intermediate-term trend has been DOWN since Jan 6th, 2026 at 234.40
![]() The short-term trend has been DOWN since Apr 6th, 2026 at 194.89
The short-term trend has been DOWN since Apr 6th, 2026 at 194.89
Smart Scan Analysis for SP500-2510
Based on our trend formula, SP500-2510 is rated as a -100 on a scale from -100 (Strong Downtrend) to +100 (Strong Uptrend).
| Open | High | Low | Price | Change |
|---|---|---|---|---|
| 198.47 | 198.47 | 186.46 | 187.65 | -1.14 |
| Prev. Close | Volume | Bid | Ask | Time |
| 188.79 | 122386139 | 2026-04-08 15:37:49 |
| 52wk High | 152.84 | 52wk High Date | 2018-01-16 |
| 52wk Low | 101.04 | 52wk Low Date | 2018-10-24 |