Index Trend Analysis Report
Prepared for you on Tuesday, April 14, 2026.
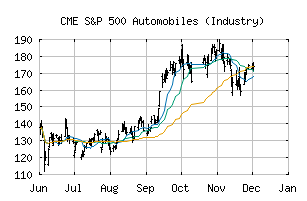
S&P 500 Automobiles (Industry) (CME:SP500-251020)
Countertrend Down (-85) - SP500-251020 is showing short-term strength. However, look for the longer-term bearish trend to resume. As always, continue to monitor the trend score and set stops.
Is it time to buy, sell, or avoid SP500-251020?
MarketClub looks at technical strength and momentum to determine if the timing is right for SP500-251020.
Learn more about the Trade Triangles and how we make technical analysis as easy as buy and sell.
|
|||||||||||||||
|
|||||||||||||||
MarketClub’s Trade Triangles for SP500-251020
![]() The long-term trend has been DOWN since Mar 2nd, 2026 at 160.2
The long-term trend has been DOWN since Mar 2nd, 2026 at 160.2
![]() The intermediate-term trend has been DOWN since Jan 6th, 2026 at 177.2
The intermediate-term trend has been DOWN since Jan 6th, 2026 at 177.2
![]() The short-term trend has been UP since Apr 14th, 2026 at 146.7
The short-term trend has been UP since Apr 14th, 2026 at 146.7
Smart Scan Analysis for SP500-251020
Based on our trend formula, SP500-251020 is rated as a -85 on a scale from -100 (Strong Downtrend) to +100 (Strong Uptrend).
| Open | High | Low | Price | Change |
|---|---|---|---|---|
| 147.33 | 151.71 | 147.33 | 150.51 | +4.95 |
| Prev. Close | Volume | Bid | Ask | Time |
| 145.56 | 112776208 | 2026-04-14 16:17:23 |
| 52wk High | 120.87 | 52wk High Date | 2018-01-16 |
| 52wk Low | 78.04 | 52wk Low Date | 2018-10-24 |