Index Trend Analysis Report
Prepared for you on Wednesday, March 25, 2026.
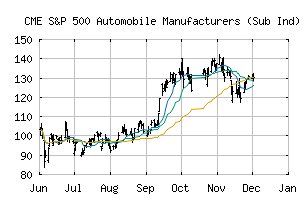
S&P 500 Automobile Manufacturers (Sub Ind) (CME:SP500-25102010)
Countertrend Down (-85) - SP500-25102010 is showing short-term strength. However, look for the longer-term bearish trend to resume. As always, continue to monitor the trend score and set stops.
Is it time to buy, sell, or avoid SP500-25102010?
MarketClub looks at technical strength and momentum to determine if the timing is right for SP500-25102010.
Learn more about the Trade Triangles and how we make technical analysis as easy as buy and sell.
|
|||||||||||||||
|
|||||||||||||||
MarketClub’s Trade Triangles for SP500-25102010
![]() The long-term trend has been DOWN since Mar 2nd, 2026 at 120.08
The long-term trend has been DOWN since Mar 2nd, 2026 at 120.08
![]() The intermediate-term trend has been DOWN since Jan 6th, 2026 at 132.82
The intermediate-term trend has been DOWN since Jan 6th, 2026 at 132.82
![]() The short-term trend has been UP since Mar 24th, 2026 at 118.12
The short-term trend has been UP since Mar 24th, 2026 at 118.12
Smart Scan Analysis for SP500-25102010
Based on our trend formula, SP500-25102010 is rated as a -85 on a scale from -100 (Strong Downtrend) to +100 (Strong Uptrend).
| Open | High | Low | Price | Change |
|---|---|---|---|---|
| 119.78 | 121.13 | 117.98 | 118.17 | +0.75 |
| Prev. Close | Volume | Bid | Ask | Time |
| 117.42 | 99672293 | 2026-03-25 16:44:44 |
| 52wk High | 89.77 | 52wk High Date | 2018-01-16 |
| 52wk Low | 57.56 | 52wk Low Date | 2018-10-24 |