Index Trend Analysis Report
Prepared for you on Thursday, March 26, 2026.
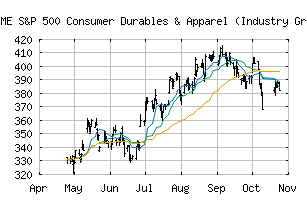
S&P 500 Consumer Durables & Apparel (Industry Group) (CME:SP500-2520)
Countertrend Down (-85) - SP500-2520 is showing short-term strength. However, look for the longer-term bearish trend to resume. As always, continue to monitor the trend score and set stops.
Is it time to buy, sell, or avoid SP500-2520?
MarketClub looks at technical strength and momentum to determine if the timing is right for SP500-2520.
Learn more about the Trade Triangles and how we make technical analysis as easy as buy and sell.
|
|||||||||||||||
|
|||||||||||||||
MarketClub’s Trade Triangles for SP500-2520
![]() The long-term trend has been DOWN since Mar 9th, 2026 at 356.17
The long-term trend has been DOWN since Mar 9th, 2026 at 356.17
![]() The intermediate-term trend has been DOWN since Mar 3rd, 2026 at 378.96
The intermediate-term trend has been DOWN since Mar 3rd, 2026 at 378.96
![]() The short-term trend has been UP since Mar 25th, 2026 at 352.61
The short-term trend has been UP since Mar 25th, 2026 at 352.61
Smart Scan Analysis for SP500-2520
Based on our trend formula, SP500-2520 is rated as a -85 on a scale from -100 (Strong Downtrend) to +100 (Strong Uptrend).
| Open | High | Low | Price | Change |
|---|---|---|---|---|
| 346.62 | 351.49 | 346.62 | 348.83 | -0.25 |
| Prev. Close | Volume | Bid | Ask | Time |
| 349.08 | 6330818 | 2026-03-26 11:05:23 |
| 52wk High | 356.82 | 52wk High Date | 2018-08-22 |
| 52wk Low | 288.91 | 52wk Low Date | 2018-10-26 |