Index Trend Analysis Report
Prepared for you on Monday, February 23, 2026.
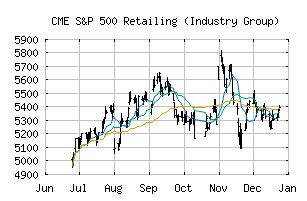
S&P 500 Retailing (Industry Group) (CME:SP500-2550)
Long-Term Downtrend (-90) - SP500-2550 is in a strong downtrend that is likely to continue. While SP500-2550 is showing intraday strength, it remains in the confines of a bearish trend. Traders should use caution and set stops.
Is it time to buy, sell, or avoid SP500-2550?
MarketClub looks at technical strength and momentum to determine if the timing is right for SP500-2550.
Learn more about the Trade Triangles and how we make technical analysis as easy as buy and sell.
|
|||||||||||||||
|
|||||||||||||||
MarketClub’s Trade Triangles for SP500-2550
![]() The long-term trend has been DOWN since Feb 6th, 2026 at 5093.35
The long-term trend has been DOWN since Feb 6th, 2026 at 5093.35
![]() The intermediate-term trend has been DOWN since Feb 5th, 2026 at 5425.45
The intermediate-term trend has been DOWN since Feb 5th, 2026 at 5425.45
![]() The short-term trend has been DOWN since Feb 23rd, 2026 at 5010.22
The short-term trend has been DOWN since Feb 23rd, 2026 at 5010.22
Smart Scan Analysis for SP500-2550
Based on our trend formula, SP500-2550 is rated as a -90 on a scale from -100 (Strong Downtrend) to +100 (Strong Uptrend).
| Open | High | Low | Price | Change |
|---|---|---|---|---|
| 5106.58 | 5111.50 | 5002.32 | 5049.27 | -95.58 |
| Prev. Close | Volume | Bid | Ask | Time |
| 5144.85 | 103246325 | 2026-02-23 16:20:08 |
| 52wk High | 2459.59 | 52wk High Date | 2018-10-01 |
| 52wk Low | 1657.5 | 52wk Low Date | 2017-12-01 |