Index Trend Analysis Report
Prepared for you on Friday, April 26, 2024.
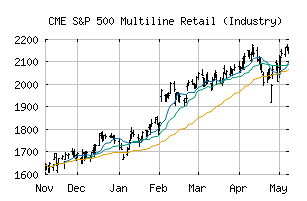
S&P 500 Multiline Retail (Industry) (CME:SP500-255030)
Crossroads (-60) - SP500-255030 is struggling to move into a solid trend. Beware of choppy markets and consider a sidelines position until a stronger trend is identified.
Is it time to buy, sell, or avoid SP500-255030?
MarketClub looks at technical strength and momentum to determine if the timing is right for SP500-255030.
Learn more about the Trade Triangles and how we make technical analysis as easy as buy and sell.
|
|||||||||||||||
|
|||||||||||||||
MarketClub’s Trade Triangles for SP500-255030
![]() The long-term trend has been UP since Nov 14th, 2023 at 1679.87
The long-term trend has been UP since Nov 14th, 2023 at 1679.87
![]() The intermediate-term trend has been DOWN since Apr 19th, 2024 at 2038.74
The intermediate-term trend has been DOWN since Apr 19th, 2024 at 2038.74
![]() The short-term trend has been DOWN since Apr 25th, 2024 at 2007.18
The short-term trend has been DOWN since Apr 25th, 2024 at 2007.18
Smart Scan Analysis for SP500-255030
Based on our trend formula, SP500-255030 is rated as a -60 on a scale from -100 (Strong Downtrend) to +100 (Strong Uptrend).
| Open | High | Low | Price | Change |
|---|---|---|---|---|
| 1922.13 | 2000.19 | 1922.08 | 1997.62 | -32.71 |
| Prev. Close | Volume | Bid | Ask | Time |
| 1997.62 | 52068980 | 2024-04-25 16:19:53 |
| 52wk High | 843.64 | 52wk High Date | 2018-11-08 |
| 52wk Low | 628.86 | 52wk Low Date | 2017-12-01 |