Index Trend Analysis Report
Prepared for you on Monday, June 30, 2025.
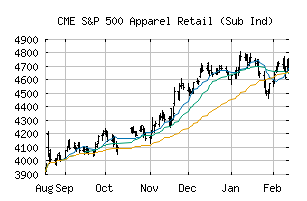
S&P 500 Apparel Retail (Sub Ind) (CME:SP500-25504010)
Crossroads (-60) - SP500-25504010 is struggling to move into a solid trend. Beware of choppy markets and consider a sidelines position until a stronger trend is identified.
Is it time to buy, sell, or avoid SP500-25504010?
MarketClub looks at technical strength and momentum to determine if the timing is right for SP500-25504010.
Learn more about the Trade Triangles and how we make technical analysis as easy as buy and sell.
|
|||||||||||||||
|
|||||||||||||||
MarketClub’s Trade Triangles for SP500-25504010
![]() The long-term trend has been UP since Apr 14th, 2025 at 3823.03
The long-term trend has been UP since Apr 14th, 2025 at 3823.03
![]() The intermediate-term trend has been DOWN since May 23rd, 2025 at 3719.69
The intermediate-term trend has been DOWN since May 23rd, 2025 at 3719.69
![]() The short-term trend has been DOWN since Jun 26th, 2025 at 3559.49
The short-term trend has been DOWN since Jun 26th, 2025 at 3559.49
Smart Scan Analysis for SP500-25504010
Based on our trend formula, SP500-25504010 is rated as a -60 on a scale from -100 (Strong Downtrend) to +100 (Strong Uptrend).
| Open | High | Low | Price | Change |
|---|---|---|---|---|
| 3594.14 | 3604.29 | 3558.96 | 3588.57 | +0.35 |
| Prev. Close | Volume | Bid | Ask | Time |
| 3588.22 | 8750231 | 2025-06-30 16:20:04 |
| 52wk High | 1860.12 | 52wk High Date | 2018-11-12 |
| 52wk Low | 1376.07 | 52wk Low Date | 2018-02-06 |