Index Trend Analysis Report
Prepared for you on Tuesday, April 14, 2026.
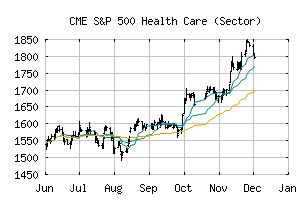
S&P 500 Health Care (Sector) (CME:SP500-35)
Bear Market Rally (-75) - SP500-35 is showing some rallying power, but still remains in the confines of a long-term downtrend. Keep an eye on SP500-35 as it may be in the beginning of a reversal.
Is it time to buy, sell, or avoid SP500-35?
MarketClub looks at technical strength and momentum to determine if the timing is right for SP500-35.
Learn more about the Trade Triangles and how we make technical analysis as easy as buy and sell.
|
|||||||||||||||
|
|||||||||||||||
MarketClub’s Trade Triangles for SP500-35
![]() The long-term trend has been DOWN since Mar 13th, 2026 at 1742.38
The long-term trend has been DOWN since Mar 13th, 2026 at 1742.38
![]() The intermediate-term trend has been DOWN since Mar 5th, 2026 at 1799.15
The intermediate-term trend has been DOWN since Mar 5th, 2026 at 1799.15
![]() The short-term trend has been DOWN since Apr 13th, 2026 at 1716.00
The short-term trend has been DOWN since Apr 13th, 2026 at 1716.00
Smart Scan Analysis for SP500-35
Based on our trend formula, SP500-35 is rated as a -80 on a scale from -100 (Strong Downtrend) to +100 (Strong Uptrend).
| Open | High | Low | Price | Change |
|---|---|---|---|---|
| 1722.44 | 1744.70 | 1718.97 | 1735.07 | +8.58 |
| Prev. Close | Volume | Bid | Ask | Time |
| 1726.49 | 191994714 | 2026-04-14 16:17:27 |
| 52wk High | 1112.21 | 52wk High Date | 2018-10-01 |
| 52wk Low | 912.01 | 52wk Low Date | 2018-04-02 |