Index Trend Analysis Report
Prepared for you on Wednesday, March 25, 2026.
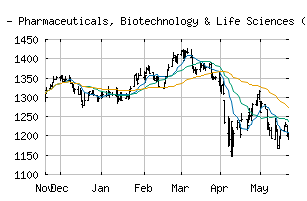
S&P 500 - Pharmaceuticals, Biotechnology & Life Sciences (Industry Group) (CME:SP500-3520)
Sidelines Mode (-55) - SP500-3520 is moving in a sideways pattern and is unable to gain momentum in either direction. Beware of choppy movement and consider a sidelines position until a stronger trend is identified.
Is it time to buy, sell, or avoid SP500-3520?
MarketClub looks at technical strength and momentum to determine if the timing is right for SP500-3520.
Learn more about the Trade Triangles and how we make technical analysis as easy as buy and sell.
|
|||||||||||||||
|
|||||||||||||||
MarketClub’s Trade Triangles for SP500-3520
![]() The long-term trend has been UP since Sep 30th, 2025 at 1321.12
The long-term trend has been UP since Sep 30th, 2025 at 1321.12
![]() The intermediate-term trend has been DOWN since Mar 3rd, 2026 at 1600.88
The intermediate-term trend has been DOWN since Mar 3rd, 2026 at 1600.88
![]() The short-term trend has been UP since Mar 25th, 2026 at 1520.29
The short-term trend has been UP since Mar 25th, 2026 at 1520.29
Smart Scan Analysis for SP500-3520
Based on our trend formula, SP500-3520 is rated as a -55 on a scale from -100 (Strong Downtrend) to +100 (Strong Uptrend).
| Open | High | Low | Price | Change |
|---|---|---|---|---|
| 1516.64 | 1532.99 | 1516.64 | 1526.36 | +19.86 |
| Prev. Close | Volume | Bid | Ask | Time |
| 1506.50 | 106712905 | 2026-03-25 16:44:44 |
| 52wk High | 941.92 | 52wk High Date | 2018-10-03 |
| 52wk Low | 775.13 | 52wk Low Date | 2018-05-03 |