Index Trend Analysis Report
Prepared for you on Tuesday, April 14, 2026.
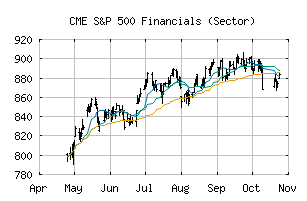
S&P 500 Financials (Sector) (CME:SP500-40)
Crossroads (+60) - SP500-40 is struggling to move into a solid trend. Beware of choppy markets and consider a sidelines position until a stronger trend is identified.
Is it time to buy, sell, or avoid SP500-40?
MarketClub looks at technical strength and momentum to determine if the timing is right for SP500-40.
Learn more about the Trade Triangles and how we make technical analysis as easy as buy and sell.
|
|||||||||||||||
|
|||||||||||||||
MarketClub’s Trade Triangles for SP500-40
![]() The long-term trend has been DOWN since Feb 23rd, 2026 at 848.82
The long-term trend has been DOWN since Feb 23rd, 2026 at 848.82
![]() The intermediate-term trend has been UP since Apr 6th, 2026 at 831.54
The intermediate-term trend has been UP since Apr 6th, 2026 at 831.54
![]() The short-term trend has been UP since Apr 14th, 2026 at 859.43
The short-term trend has been UP since Apr 14th, 2026 at 859.43
Smart Scan Analysis for SP500-40
Based on our trend formula, SP500-40 is rated as a +60 on a scale from -100 (Strong Downtrend) to +100 (Strong Uptrend).
| Open | High | Low | Price | Change |
|---|---|---|---|---|
| 857.45 | 863.35 | 856.59 | 861.10 | +1.76 |
| Prev. Close | Volume | Bid | Ask | Time |
| 859.34 | 410851571 | 2026-04-14 16:17:27 |
| 52wk High | 503.42 | 52wk High Date | 2018-01-29 |
| 52wk Low | 414.57 | 52wk Low Date | 2017-12-06 |