Index Trend Analysis Report
Prepared for you on Tuesday, April 14, 2026.
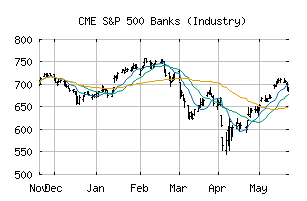
S&P 500 Banks (Industry) (CME:SP500-401010)
Crossroads (+60) - SP500-401010 is struggling to move into a solid trend. Beware of choppy markets and consider a sidelines position until a stronger trend is identified.
Is it time to buy, sell, or avoid SP500-401010?
MarketClub looks at technical strength and momentum to determine if the timing is right for SP500-401010.
Learn more about the Trade Triangles and how we make technical analysis as easy as buy and sell.
|
|||||||||||||||
|
|||||||||||||||
MarketClub’s Trade Triangles for SP500-401010
![]() The long-term trend has been DOWN since Mar 2nd, 2026 at 810.92
The long-term trend has been DOWN since Mar 2nd, 2026 at 810.92
![]() The intermediate-term trend has been UP since Apr 1st, 2026 at 813.86
The intermediate-term trend has been UP since Apr 1st, 2026 at 813.86
![]() The short-term trend has been UP since Mar 31st, 2026 at 806.66
The short-term trend has been UP since Mar 31st, 2026 at 806.66
Smart Scan Analysis for SP500-401010
Based on our trend formula, SP500-401010 is rated as a +60 on a scale from -100 (Strong Downtrend) to +100 (Strong Uptrend).
| Open | High | Low | Price | Change |
|---|---|---|---|---|
| 862.70 | 867.78 | 855.47 | 862.66 | -7.72 |
| Prev. Close | Volume | Bid | Ask | Time |
| 870.38 | 185795709 | 2026-04-14 16:17:23 |
| 52wk High | 534.73 | 52wk High Date | 2018-01-29 |
| 52wk Low | 433.61 | 52wk Low Date | 2018-10-24 |