Index Trend Analysis Report
Prepared for you on Tuesday, March 17, 2026.
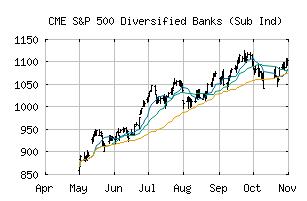
S&P 500 Diversified Banks (Sub Ind) (CME:SP500-40101010)
Long-Term Downtrend (-90) - SP500-40101010 is in a strong downtrend that is likely to continue. While SP500-40101010 is showing intraday strength, it remains in the confines of a bearish trend. Traders should use caution and set stops.
Is it time to buy, sell, or avoid SP500-40101010?
MarketClub looks at technical strength and momentum to determine if the timing is right for SP500-40101010.
Learn more about the Trade Triangles and how we make technical analysis as easy as buy and sell.
|
|||||||||||||||
|
|||||||||||||||
MarketClub’s Trade Triangles for SP500-40101010
![]() The long-term trend has been DOWN since Mar 2nd, 2026 at 1074.68
The long-term trend has been DOWN since Mar 2nd, 2026 at 1074.68
![]() The intermediate-term trend has been DOWN since Feb 23rd, 2026 at 1106.18
The intermediate-term trend has been DOWN since Feb 23rd, 2026 at 1106.18
![]() The short-term trend has been DOWN since Feb 11th, 2026 at 1172.43
The short-term trend has been DOWN since Feb 11th, 2026 at 1172.43
Smart Scan Analysis for SP500-40101010
Based on our trend formula, SP500-40101010 is rated as a -90 on a scale from -100 (Strong Downtrend) to +100 (Strong Uptrend).
| Open | High | Low | Price | Change |
|---|---|---|---|---|
| 1034.17 | 1044.30 | 1029.42 | 1033.62 | +11.06 |
| Prev. Close | Volume | Bid | Ask | Time |
| 1033.62 | 119694639 | 2026-03-16 16:18:08 |
| 52wk High | 638.47 | 52wk High Date | 2018-01-29 |
| 52wk Low | 521.93 | 52wk Low Date | 2018-10-26 |