Index Trend Analysis Report
Prepared for you on Friday, April 19, 2024.
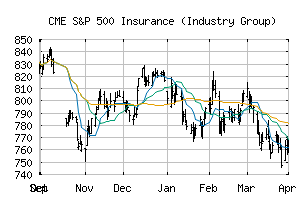
S&P 500 Insurance (Industry Group) (CME:SP500-4030)
Crossroads (-60) - SP500-4030 is struggling to move into a solid trend. Beware of choppy markets and consider a sidelines position until a stronger trend is identified.
Is it time to buy, sell, or avoid SP500-4030?
MarketClub looks at technical strength and momentum to determine if the timing is right for SP500-4030.
Learn more about the Trade Triangles and how we make technical analysis as easy as buy and sell.
|
|||||||||||||||
|
|||||||||||||||
MarketClub’s Trade Triangles for SP500-4030
![]() The long-term trend has been UP since Jul 12th, 2023 at 588.75
The long-term trend has been UP since Jul 12th, 2023 at 588.75
![]() The intermediate-term trend has been DOWN since Apr 9th, 2024 at 725.76
The intermediate-term trend has been DOWN since Apr 9th, 2024 at 725.76
![]() The short-term trend has been DOWN since Apr 3rd, 2024 at 735.28
The short-term trend has been DOWN since Apr 3rd, 2024 at 735.28
Smart Scan Analysis for SP500-4030
Based on our trend formula, SP500-4030 is rated as a -60 on a scale from -100 (Strong Downtrend) to +100 (Strong Uptrend).
| Open | High | Low | Price | Change |
|---|---|---|---|---|
| 700.59 | 707.96 | 700.59 | 704.83 | +8.59 |
| Prev. Close | Volume | Bid | Ask | Time |
| 696.24 | 35947566 | 2024-04-18 16:19:38 |
| 52wk High | 426.24 | 52wk High Date | 2018-01-29 |
| 52wk Low | 353.06 | 52wk Low Date | 2018-10-26 |