Index Trend Analysis Report
Prepared for you on Tuesday, April 14, 2026.
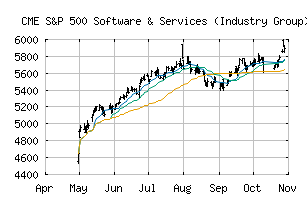
S&P 500 Software & Services (Industry Group) (CME:SP500-4510)
Sidelines Mode (-55) - SP500-4510 is moving in a sideways pattern and is unable to gain momentum in either direction. Beware of choppy movement and consider a sidelines position until a stronger trend is identified.
Is it time to buy, sell, or avoid SP500-4510?
MarketClub looks at technical strength and momentum to determine if the timing is right for SP500-4510.
Learn more about the Trade Triangles and how we make technical analysis as easy as buy and sell.
|
|||||||||||||||
|
|||||||||||||||
MarketClub’s Trade Triangles for SP500-4510
![]() The long-term trend has been DOWN since Nov 18th, 2025 at 5398.50
The long-term trend has been DOWN since Nov 18th, 2025 at 5398.50
![]() The intermediate-term trend has been DOWN since Nov 4th, 2025 at 5648.69
The intermediate-term trend has been DOWN since Nov 4th, 2025 at 5648.69
![]() The short-term trend has been UP since Apr 14th, 2026 at 4121.65
The short-term trend has been UP since Apr 14th, 2026 at 4121.65
Smart Scan Analysis for SP500-4510
Based on our trend formula, SP500-4510 is rated as a -55 on a scale from -100 (Strong Downtrend) to +100 (Strong Uptrend).
| Open | High | Low | Price | Change |
|---|---|---|---|---|
| 4170.70 | 4234.77 | 4158.70 | 4187.36 | +67.08 |
| Prev. Close | Volume | Bid | Ask | Time |
| 4120.28 | 263827727 | 2026-04-14 16:17:23 |
| 52wk High | 1919.52 | 52wk High Date | 2018-07-25 |
| 52wk Low | 1498.67 | 52wk Low Date | 2017-12-05 |