Index Trend Analysis Report
Prepared for you on Friday, March 20, 2026.
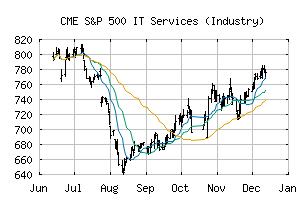
S&P 500 IT Services (Industry) (CME:SP500-451020)
Countertrend Down (-85) - SP500-451020 is showing short-term strength. However, look for the longer-term bearish trend to resume. As always, continue to monitor the trend score and set stops.
Is it time to buy, sell, or avoid SP500-451020?
MarketClub looks at technical strength and momentum to determine if the timing is right for SP500-451020.
Learn more about the Trade Triangles and how we make technical analysis as easy as buy and sell.
|
|||||||||||||||
|
|||||||||||||||
MarketClub’s Trade Triangles for SP500-451020
![]() The long-term trend has been DOWN since Feb 3rd, 2026 at 713.04
The long-term trend has been DOWN since Feb 3rd, 2026 at 713.04
![]() The intermediate-term trend has been DOWN since Feb 3rd, 2026 at 747.76
The intermediate-term trend has been DOWN since Feb 3rd, 2026 at 747.76
![]() The short-term trend has been UP since Mar 17th, 2026 at 616.45
The short-term trend has been UP since Mar 17th, 2026 at 616.45
Smart Scan Analysis for SP500-451020
Based on our trend formula, SP500-451020 is rated as a -85 on a scale from -100 (Strong Downtrend) to +100 (Strong Uptrend).
| Open | High | Low | Price | Change |
|---|---|---|---|---|
| 613.55 | 616.35 | 607.75 | 608.07 | -6.64 |
| Prev. Close | Volume | Bid | Ask | Time |
| 614.71 | 7515695 | 2026-03-20 10:57:53 |
| 52wk High | 446.86 | 52wk High Date | 2018-09-21 |
| 52wk Low | 349.82 | 52wk Low Date | 2017-12-05 |