Index Trend Analysis Report
Prepared for you on Wednesday, April 8, 2026.
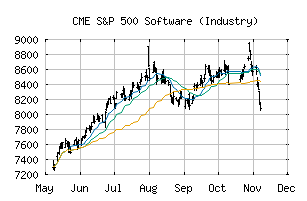
S&P 500 Software (Industry) (CME:SP500-451030)
Countertrend Down (-85) - SP500-451030 is showing short-term strength. However, look for the longer-term bearish trend to resume. As always, continue to monitor the trend score and set stops.
Is it time to buy, sell, or avoid SP500-451030?
MarketClub looks at technical strength and momentum to determine if the timing is right for SP500-451030.
Learn more about the Trade Triangles and how we make technical analysis as easy as buy and sell.
|
|||||||||||||||
|
|||||||||||||||
MarketClub’s Trade Triangles for SP500-451030
![]() The long-term trend has been DOWN since Nov 7th, 2025 at 8064.48
The long-term trend has been DOWN since Nov 7th, 2025 at 8064.48
![]() The intermediate-term trend has been DOWN since Nov 4th, 2025 at 8445.79
The intermediate-term trend has been DOWN since Nov 4th, 2025 at 8445.79
![]() The short-term trend has been UP since Apr 1st, 2026 at 6058.15
The short-term trend has been UP since Apr 1st, 2026 at 6058.15
Smart Scan Analysis for SP500-451030
Based on our trend formula, SP500-451030 is rated as a -85 on a scale from -100 (Strong Downtrend) to +100 (Strong Uptrend).
| Open | High | Low | Price | Change |
|---|---|---|---|---|
| 6271.66 | 6271.66 | 6109.48 | 6112.56 | +54.22 |
| Prev. Close | Volume | Bid | Ask | Time |
| 6058.34 | 93989137 | 2026-04-08 12:26:23 |
| 52wk High | 2180.19 | 52wk High Date | 2018-10-01 |
| 52wk Low | 1549.04 | 52wk Low Date | 2017-12-06 |