Index Trend Analysis Report
Prepared for you on Wednesday, March 25, 2026.
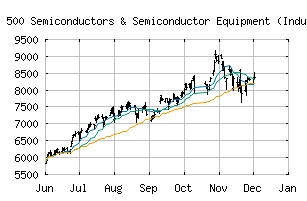
S&P 500 Semiconductors & Semiconductor Equipment (Industry Group) (CME:SP500-4530)
Sidelines Mode (-55) - SP500-4530 is moving in a sideways pattern and is unable to gain momentum in either direction. Beware of choppy movement and consider a sidelines position until a stronger trend is identified.
Is it time to buy, sell, or avoid SP500-4530?
MarketClub looks at technical strength and momentum to determine if the timing is right for SP500-4530.
Learn more about the Trade Triangles and how we make technical analysis as easy as buy and sell.
|
|||||||||||||||
|
|||||||||||||||
MarketClub’s Trade Triangles for SP500-4530
![]() The long-term trend has been UP since Jun 3rd, 2025 at 6049.76
The long-term trend has been UP since Jun 3rd, 2025 at 6049.76
![]() The intermediate-term trend has been DOWN since Mar 2nd, 2026 at 8471.23
The intermediate-term trend has been DOWN since Mar 2nd, 2026 at 8471.23
![]() The short-term trend has been UP since Mar 25th, 2026 at 8517.74
The short-term trend has been UP since Mar 25th, 2026 at 8517.74
Smart Scan Analysis for SP500-4530
Based on our trend formula, SP500-4530 is rated as a -55 on a scale from -100 (Strong Downtrend) to +100 (Strong Uptrend).
| Open | High | Low | Price | Change |
|---|---|---|---|---|
| 8458.59 | 8560.17 | 8421.88 | 8468.23 | +104.51 |
| Prev. Close | Volume | Bid | Ask | Time |
| 8363.72 | 429669518 | 2026-03-25 16:44:44 |
| 52wk High | 1095.24 | 52wk High Date | 2018-06-07 |
| 52wk Low | 826.22 | 52wk Low Date | 2018-11-20 |