Index Trend Analysis Report
Prepared for you on Thursday, April 2, 2026.
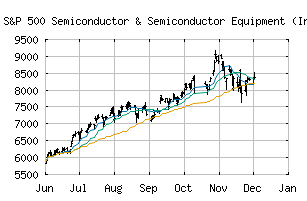
S&P 500 Semiconductor & Semiconductor Equipment (Industry) (CME:SP500-453010)
Bear Market Rally (-75) - SP500-453010 is showing some rallying power, but still remains in the confines of a long-term downtrend. Keep an eye on SP500-453010 as it may be in the beginning of a reversal.
Is it time to buy, sell, or avoid SP500-453010?
MarketClub looks at technical strength and momentum to determine if the timing is right for SP500-453010.
Learn more about the Trade Triangles and how we make technical analysis as easy as buy and sell.
|
|||||||||||||||
|
|||||||||||||||
MarketClub’s Trade Triangles for SP500-453010
![]() The long-term trend has been DOWN since Mar 30th, 2026 at 7748.60
The long-term trend has been DOWN since Mar 30th, 2026 at 7748.60
![]() The intermediate-term trend has been DOWN since Mar 2nd, 2026 at 8471.23
The intermediate-term trend has been DOWN since Mar 2nd, 2026 at 8471.23
![]() The short-term trend has been UP since Apr 1st, 2026 at 8160.79
The short-term trend has been UP since Apr 1st, 2026 at 8160.79
Smart Scan Analysis for SP500-453010
Based on our trend formula, SP500-453010 is rated as a -75 on a scale from -100 (Strong Downtrend) to +100 (Strong Uptrend).
| Open | High | Low | Price | Change |
|---|---|---|---|---|
| 8092.51 | 8337.12 | 8041.36 | 8321.34 | +16.17 |
| Prev. Close | Volume | Bid | Ask | Time |
| 8305.17 | 201190242 | 2026-04-02 11:27:53 |
| 52wk High | 1095.24 | 52wk High Date | 2018-06-07 |
| 52wk Low | 826.22 | 52wk Low Date | 2018-11-20 |