Index Trend Analysis Report
Prepared for you on Tuesday, April 14, 2026.
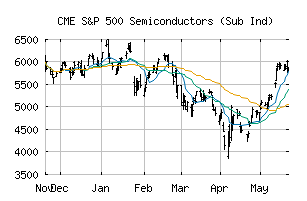
S&P 500 Semiconductors (Sub Ind) (CME:SP500-45301020)
Strong Uptrend (+100) - SP500-45301020 is in a strong uptrend that is likely to continue. With short-term, intermediate, and long-term bullish momentum, SP500-45301020 continues to climb. Traders should protect gains and look for a change in score to suggest a slow down in momentum.
Is it time to buy, sell, or avoid SP500-45301020?
MarketClub looks at technical strength and momentum to determine if the timing is right for SP500-45301020.
Learn more about the Trade Triangles and how we make technical analysis as easy as buy and sell.
|
|||||||||||||||
|
|||||||||||||||
MarketClub’s Trade Triangles for SP500-45301020
![]() The long-term trend has been UP since Apr 10th, 2026 at 8993.25
The long-term trend has been UP since Apr 10th, 2026 at 8993.25
![]() The intermediate-term trend has been UP since Apr 8th, 2026 at 8628.77
The intermediate-term trend has been UP since Apr 8th, 2026 at 8628.77
![]() The short-term trend has been UP since Apr 1st, 2026 at 8011.83
The short-term trend has been UP since Apr 1st, 2026 at 8011.83
Smart Scan Analysis for SP500-45301020
Based on our trend formula, SP500-45301020 is rated as a +100 on a scale from -100 (Strong Downtrend) to +100 (Strong Uptrend).
| Open | High | Low | Price | Change |
|---|---|---|---|---|
| 9210.34 | 9395.21 | 9147.11 | 9395.21 | +258.20 |
| Prev. Close | Volume | Bid | Ask | Time |
| 9137.01 | 408450444 | 2026-04-14 16:17:23 |
| 52wk High | 1076.14 | 52wk High Date | 2018-06-07 |
| 52wk Low | 817.88 | 52wk Low Date | 2018-11-20 |