Index Trend Analysis Report
Prepared for you on Tuesday, March 31, 2026.
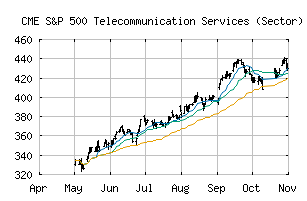
S&P 500 Telecommunication Services (Sector) (CME:SP500-50)
Strong Downtrend (-100) - SP500-50 is in a strong downtrend that is likely to continue. With short-term, intermediate, and long-term bearish momentum, SP500-50 continues to fall. Traders should use caution and set stops.
Is it time to buy, sell, or avoid SP500-50?
MarketClub looks at technical strength and momentum to determine if the timing is right for SP500-50.
Learn more about the Trade Triangles and how we make technical analysis as easy as buy and sell.
|
|||||||||||||||
|
|||||||||||||||
MarketClub’s Trade Triangles for SP500-50
![]() The long-term trend has been DOWN since Mar 20th, 2026 at 432.03
The long-term trend has been DOWN since Mar 20th, 2026 at 432.03
![]() The intermediate-term trend has been DOWN since Feb 13th, 2026 at 441.84
The intermediate-term trend has been DOWN since Feb 13th, 2026 at 441.84
![]() The short-term trend has been DOWN since Mar 19th, 2026 at 440.22
The short-term trend has been DOWN since Mar 19th, 2026 at 440.22
Smart Scan Analysis for SP500-50
Based on our trend formula, SP500-50 is rated as a -100 on a scale from -100 (Strong Downtrend) to +100 (Strong Uptrend).
| Open | High | Low | Price | Change |
|---|---|---|---|---|
| 404.13 | 405.45 | 400.61 | 402.51 | +1.52 |
| Prev. Close | Volume | Bid | Ask | Time |
| 402.51 | 299217446 | 2026-03-30 16:19:57 |
| 52wk High | 169.66 | 52wk High Date | 2018-02-01 |
| 52wk Low | 140.34 | 52wk Low Date | 2018-05-09 |