Index Trend Analysis Report
Prepared for you on Wednesday, March 25, 2026.
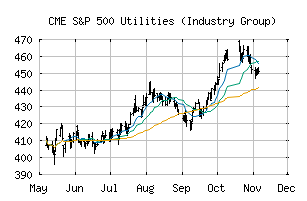
S&P 500 Utilities (Industry Group) (CME:SP500-5510)
Weak Downtrend (-65) - SP500-5510 is showing signs of a strengthening downtrend. Monitor SP500-5510 as it may be building momentum to the downside.
Is it time to buy, sell, or avoid SP500-5510?
MarketClub looks at technical strength and momentum to determine if the timing is right for SP500-5510.
Learn more about the Trade Triangles and how we make technical analysis as easy as buy and sell.
|
|||||||||||||||
|
|||||||||||||||
MarketClub’s Trade Triangles for SP500-5510
![]() The long-term trend has been UP since Feb 12th, 2026 at 458.41
The long-term trend has been UP since Feb 12th, 2026 at 458.41
![]() The intermediate-term trend has been DOWN since Mar 20th, 2026 at 464.80
The intermediate-term trend has been DOWN since Mar 20th, 2026 at 464.80
![]() The short-term trend has been DOWN since Mar 18th, 2026 at 473.42
The short-term trend has been DOWN since Mar 18th, 2026 at 473.42
Smart Scan Analysis for SP500-5510
Based on our trend formula, SP500-5510 is rated as a -70 on a scale from -100 (Strong Downtrend) to +100 (Strong Uptrend).
| Open | High | Low | Price | Change |
|---|---|---|---|---|
| 462.78 | 463.90 | 459.70 | 459.90 | +1.39 |
| Prev. Close | Volume | Bid | Ask | Time |
| 458.51 | 112016701 | 2026-03-25 16:44:44 |
| 52wk High | 286.94 | 52wk High Date | 2017-12-01 |
| 52wk Low | 240.4 | 52wk Low Date | 2018-02-06 |