Index Trend Analysis Report
Prepared for you on Tuesday, July 1, 2025.
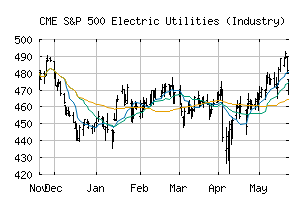
S&P 500 Electric Utilities (Industry) (CME:SP500-551010)
Bull Market Weakness (+75) - SP500-551010 is showing signs of short-term weakness, but still remains in the confines of a long-term uptrend. Keep an eye on SP500-551010 as it may be in the beginning stages of a reversal.
Is it time to buy, sell, or avoid SP500-551010?
MarketClub looks at technical strength and momentum to determine if the timing is right for SP500-551010.
Learn more about the Trade Triangles and how we make technical analysis as easy as buy and sell.
|
|||||||||||||||
|
|||||||||||||||
MarketClub’s Trade Triangles for SP500-551010
![]() The long-term trend has been UP since May 6th, 2025 at 477.33
The long-term trend has been UP since May 6th, 2025 at 477.33
![]() The intermediate-term trend has been DOWN since Jun 17th, 2025 at 472.54
The intermediate-term trend has been DOWN since Jun 17th, 2025 at 472.54
![]() The short-term trend has been UP since Jun 23rd, 2025 at 477.30
The short-term trend has been UP since Jun 23rd, 2025 at 477.30
Smart Scan Analysis for SP500-551010
Based on our trend formula, SP500-551010 is rated as a +75 on a scale from -100 (Strong Downtrend) to +100 (Strong Uptrend).
| Open | High | Low | Price | Change |
|---|---|---|---|---|
| 476.02 | 481.60 | 474.70 | 481.16 | +1.11 |
| Prev. Close | Volume | Bid | Ask | Time |
| 481.16 | 110208259 | 2025-06-30 16:20:08 |
| 52wk High | 318.49 | 52wk High Date | 2017-12-01 |
| 52wk Low | 264.54 | 52wk Low Date | 2018-02-06 |