Index Trend Analysis Report
Prepared for you on Wednesday, February 5, 2025.
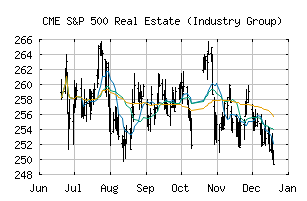
S&P 500 Real Estate (Industry Group) (CME:SP500-6010)
Sidelines Mode (+55) - SP500-6010 is moving in a sideways pattern and is unable to gain momentum in either direction. Beware of choppy movement and consider a sidelines position until a stronger trend is identified.
Is it time to buy, sell, or avoid SP500-6010?
MarketClub looks at technical strength and momentum to determine if the timing is right for SP500-6010.
Learn more about the Trade Triangles and how we make technical analysis as easy as buy and sell.
|
|||||||||||||||
|
|||||||||||||||
MarketClub’s Trade Triangles for SP500-6010
![]() The long-term trend has been DOWN since Dec 17th, 2024 at 263.16
The long-term trend has been DOWN since Dec 17th, 2024 at 263.16
![]() The intermediate-term trend has been UP since Jan 15th, 2025 at 256.39
The intermediate-term trend has been UP since Jan 15th, 2025 at 256.39
![]() The short-term trend has been DOWN since Jan 29th, 2025 at 256.89
The short-term trend has been DOWN since Jan 29th, 2025 at 256.89
Smart Scan Analysis for SP500-6010
Based on our trend formula, SP500-6010 is rated as a +55 on a scale from -100 (Strong Downtrend) to +100 (Strong Uptrend).
| Open | High | Low | Price | Change |
|---|---|---|---|---|
| 259.47 | 259.69 | 257.29 | 259.31 | +2.51 |
| Prev. Close | Volume | Bid | Ask | Time |
| 256.80 | 7031721 | 2025-02-05 10:30:09 |
| 52wk High | 217.53 | 52wk High Date | 2017-12-06 |
| 52wk Low | 180.54 | 52wk Low Date | 2018-02-09 |