Index Trend Analysis Report
Prepared for you on Wednesday, March 18, 2026.
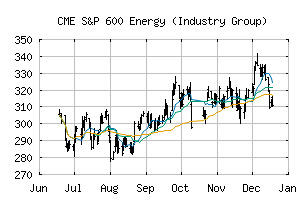
S&P 600 Energy (Industry Group) (CME:SP600-1010)
Long-Term Uptrend (+90) - SP600-1010 is in a strong uptrend that is likely to continue. While SP600-1010 is showing intraday weakness, it remains in the confines of a bullish trend. Traders should use caution and utilize a stop order.
Is it time to buy, sell, or avoid SP600-1010?
MarketClub looks at technical strength and momentum to determine if the timing is right for SP600-1010.
Learn more about the Trade Triangles and how we make technical analysis as easy as buy and sell.
|
|||||||||||||||
|
|||||||||||||||
MarketClub’s Trade Triangles for SP600-1010
![]() The long-term trend has been UP since Sep 17th, 2025 at 309.63
The long-term trend has been UP since Sep 17th, 2025 at 309.63
![]() The intermediate-term trend has been UP since Dec 3rd, 2025 at 327.26
The intermediate-term trend has been UP since Dec 3rd, 2025 at 327.26
![]() The short-term trend has been UP since Feb 27th, 2026 at 405.69
The short-term trend has been UP since Feb 27th, 2026 at 405.69
Smart Scan Analysis for SP600-1010
Based on our trend formula, SP600-1010 is rated as a +90 on a scale from -100 (Strong Downtrend) to +100 (Strong Uptrend).
| Open | High | Low | Price | Change |
|---|---|---|---|---|
| 429.19 | 433.26 | 427.19 | 431.23 | +2.79 |
| Prev. Close | Volume | Bid | Ask | Time |
| 428.44 | 68392127 | 2026-03-18 16:18:41 |
| 52wk High | 681.82 | 52wk High Date | 2018-05-22 |
| 52wk Low | 414.57 | 52wk Low Date | 2018-11-28 |